Choose a suitable plan
Compare midday rates, evening rates, daily supply charges and any free-energy limits against your usage.

HOME BATTERIES · WITHOUT ROOFTOP SOLAR
You don’t need to generate solar energy to benefit from Australia’s solar energy revolution.
Discover how a Sunterra manager’s family paired a home battery with a midday free-electricity plan — while keeping their century old Tudor roof untouched.
01 / THE TUDOR FAMILY STORY
A four-bedroom Tudor-style home in Adelaide, more than 100 years old. Steep rooflines, multiple pitches and the architectural character that makes an old house special.
The family explored rooftop solar, but the roof’s complexity made it an unsuitable option for this project. Waterproofing and long-term maintenance were concerns they wanted to avoid.
“I would run away from it using my fastest sneakers.”An installer’s joke, as recalled by the homeowner
So they looked for another way to manage electricity costs — without changing the roof.
THE HOUSEHOLD
Two adults. Three children. An all-electric home with no gas and no swimming pool. Everyday family life, rather than a controlled battery experiment.
Lighting, electric panel heaters, two hot-water systems (one for the bathroom and one for the kitchen and laundry), an induction cooktop and oven, a washing machine and dryer.
An electric lawn mower, drills, blowers and other power tools, along with the children’s game consoles, computers and gaming stations.
02 / AUSTRALIA’S ELECTRICITY OPPORTUNITY
Australia’s solar generation can create an opportunity to shift electricity use into the middle of the day. Some retail plans offer cheaper or free usage during a defined window.
The Solar Sharer Offer gives eligible households a daily free-electricity window. You do not need your own solar panels to benefit. A compatible battery can store grid energy for use later.
A free usage window does not mean a free electricity bill. Supply charges, rates outside the window, eligibility and reasonable-use limits matter. Compare the whole plan; availability varies by location.
Learn more: Australian Government · Energy Made Easy
THE IDEA
For this household, the homeowner reports using Solar Sharer. Check the current plan terms, eligibility and charging window for your own address.
03 / HOW IT WORKS
The home stays connected to the grid. The battery stores electricity; it does not generate it.
Compare midday rates, evening rates, daily supply charges and any free-energy limits against your usage.
Configure compatible equipment to charge during the eligible low-cost window, within plan and system limits.
Use stored energy outside that window. The grid supplies any demand beyond the battery’s available energy or power.
Review actual bills and operating data. Adjust the schedule and reserve as the family’s needs or tariff change.
04 / REAL HOME · DISCLOSED INTERNAL CONNECTION
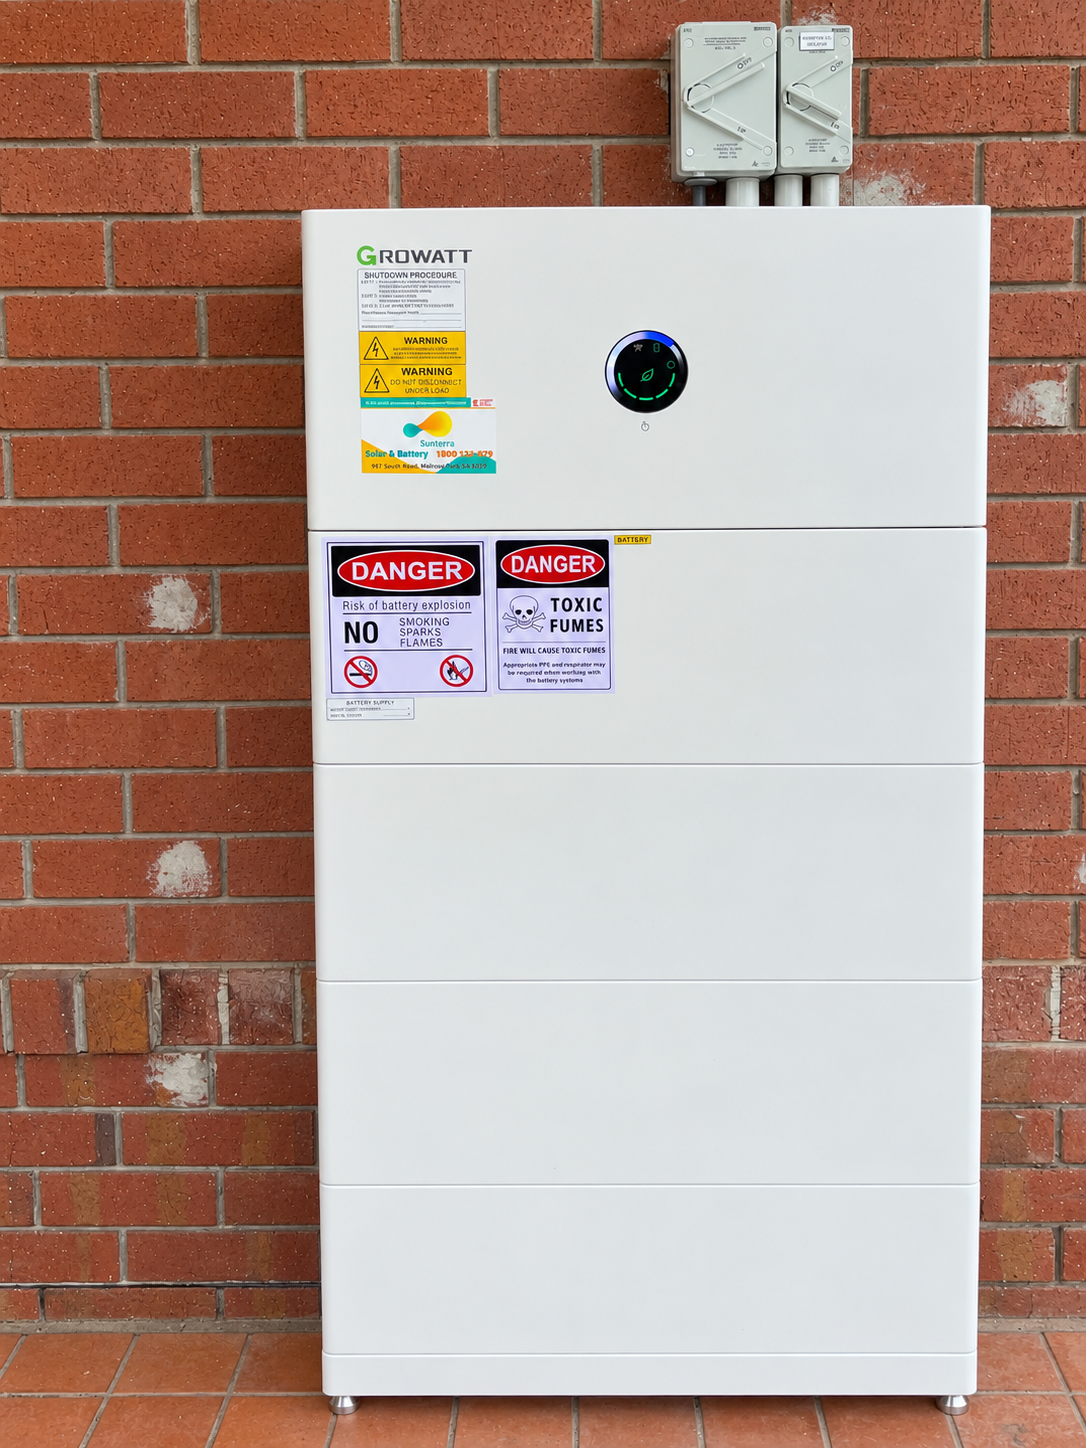
This is the private residence of a Sunterra internal manager. We disclose that connection so you can assess the story in context.
The household’s cost is a case-specific figure, not a Sunterra price offer. Equipment, installation scope and tariff terms should be confirmed for each new project.
GROWATT APP · COMMISSIONING DAY
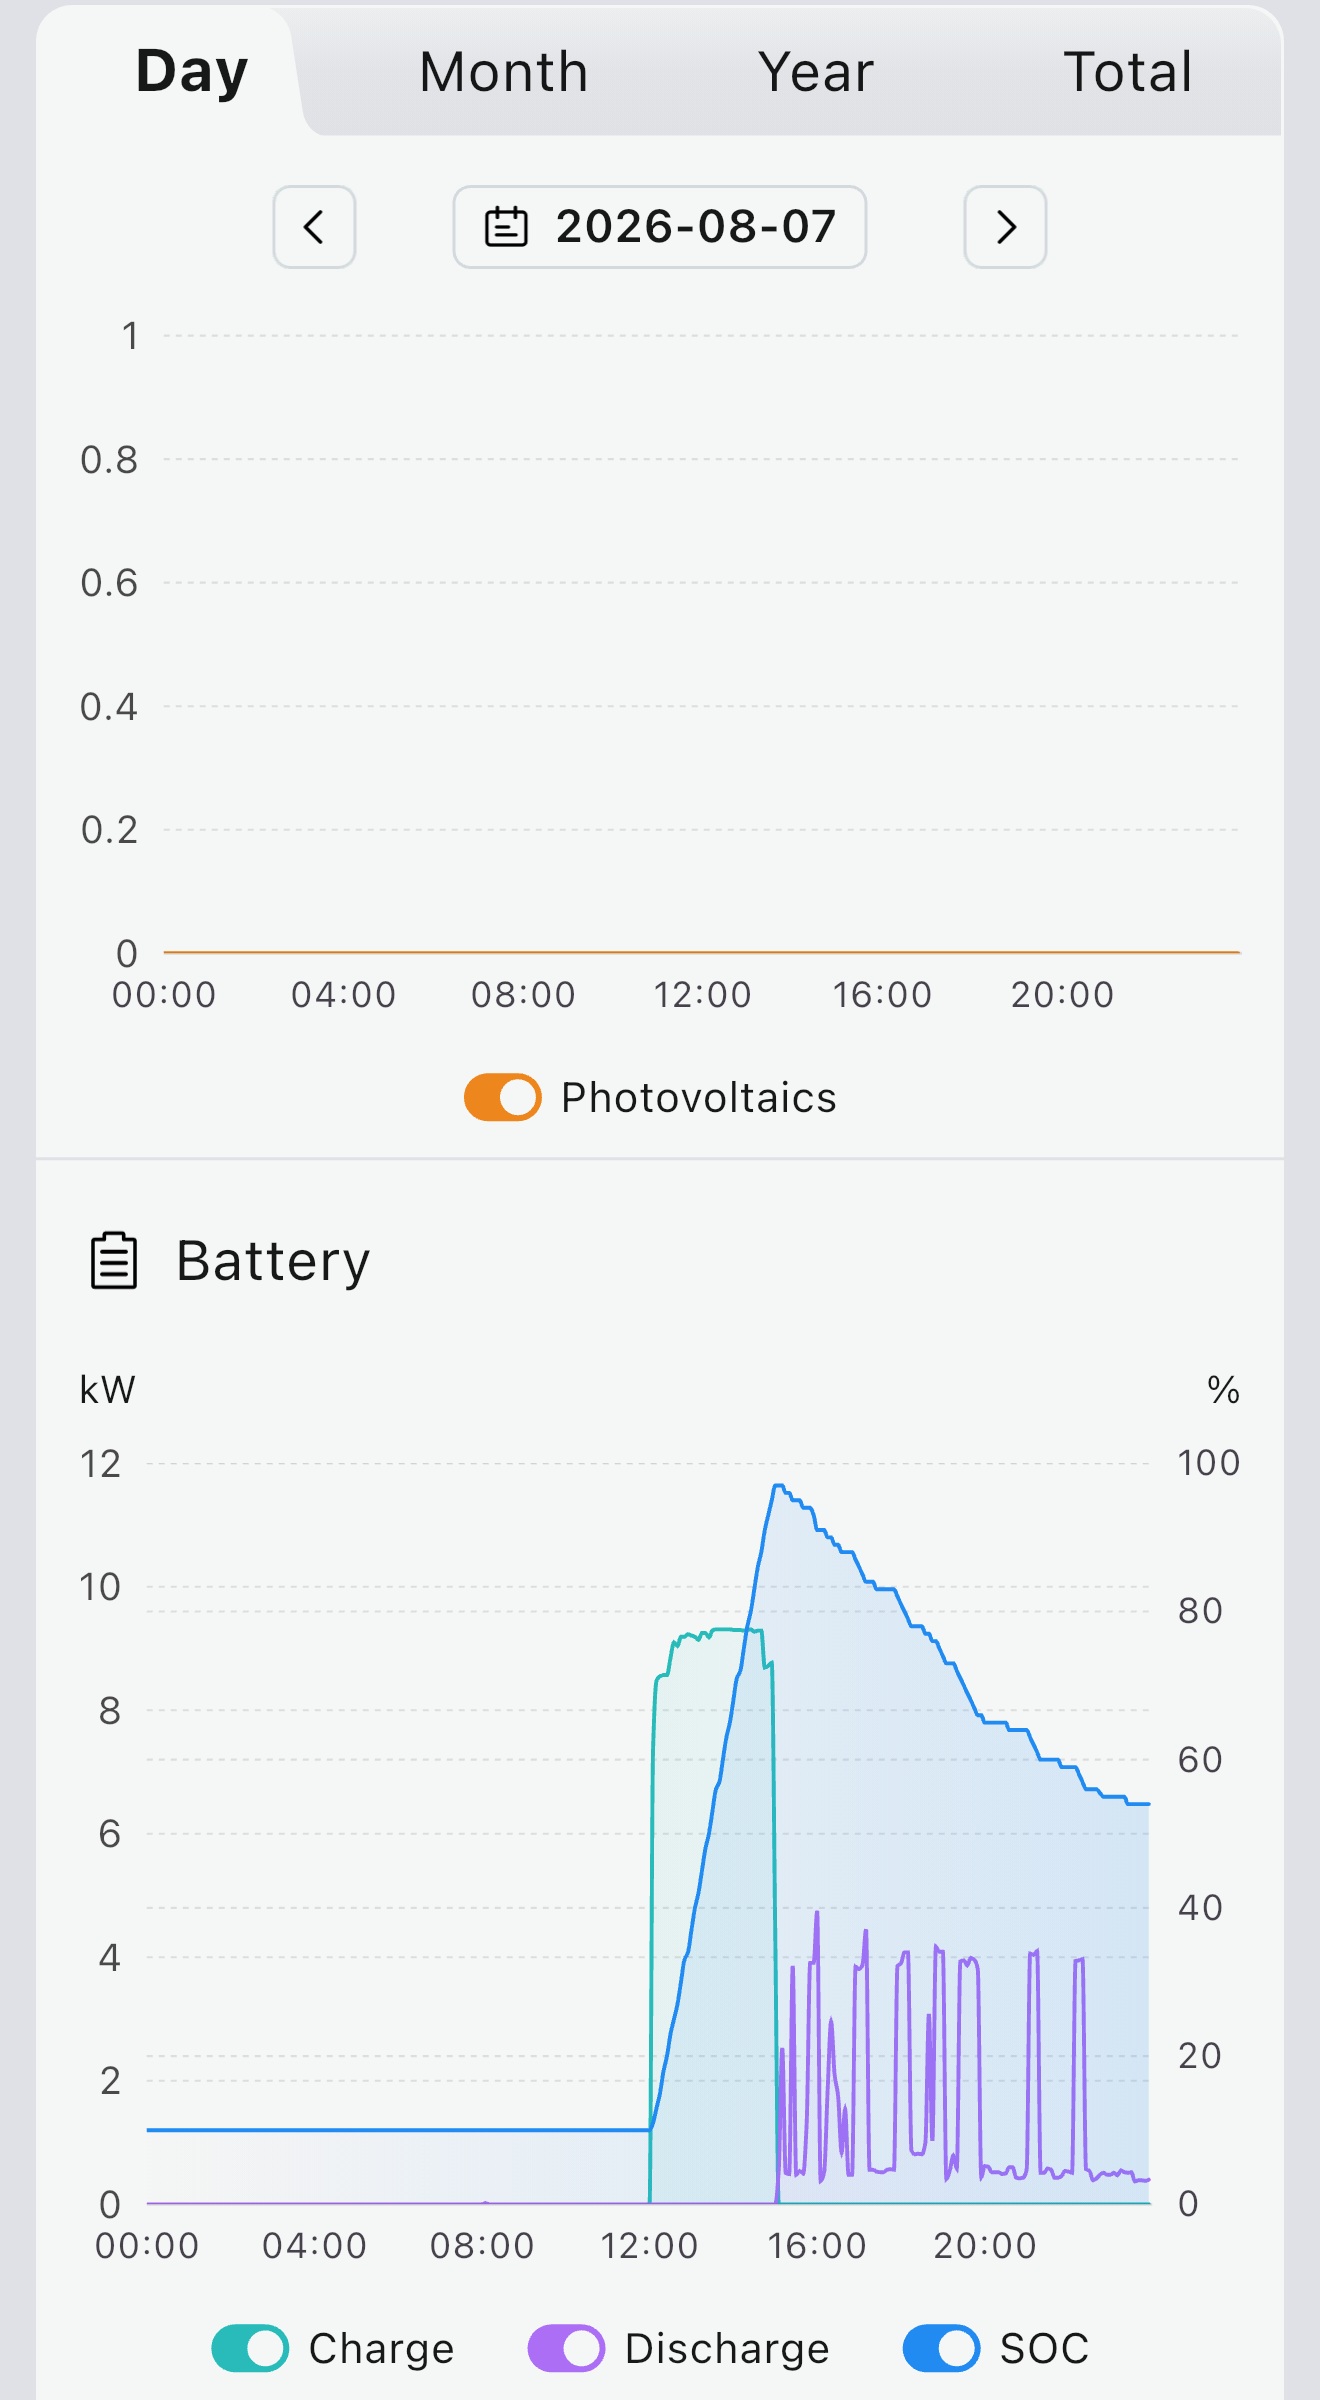
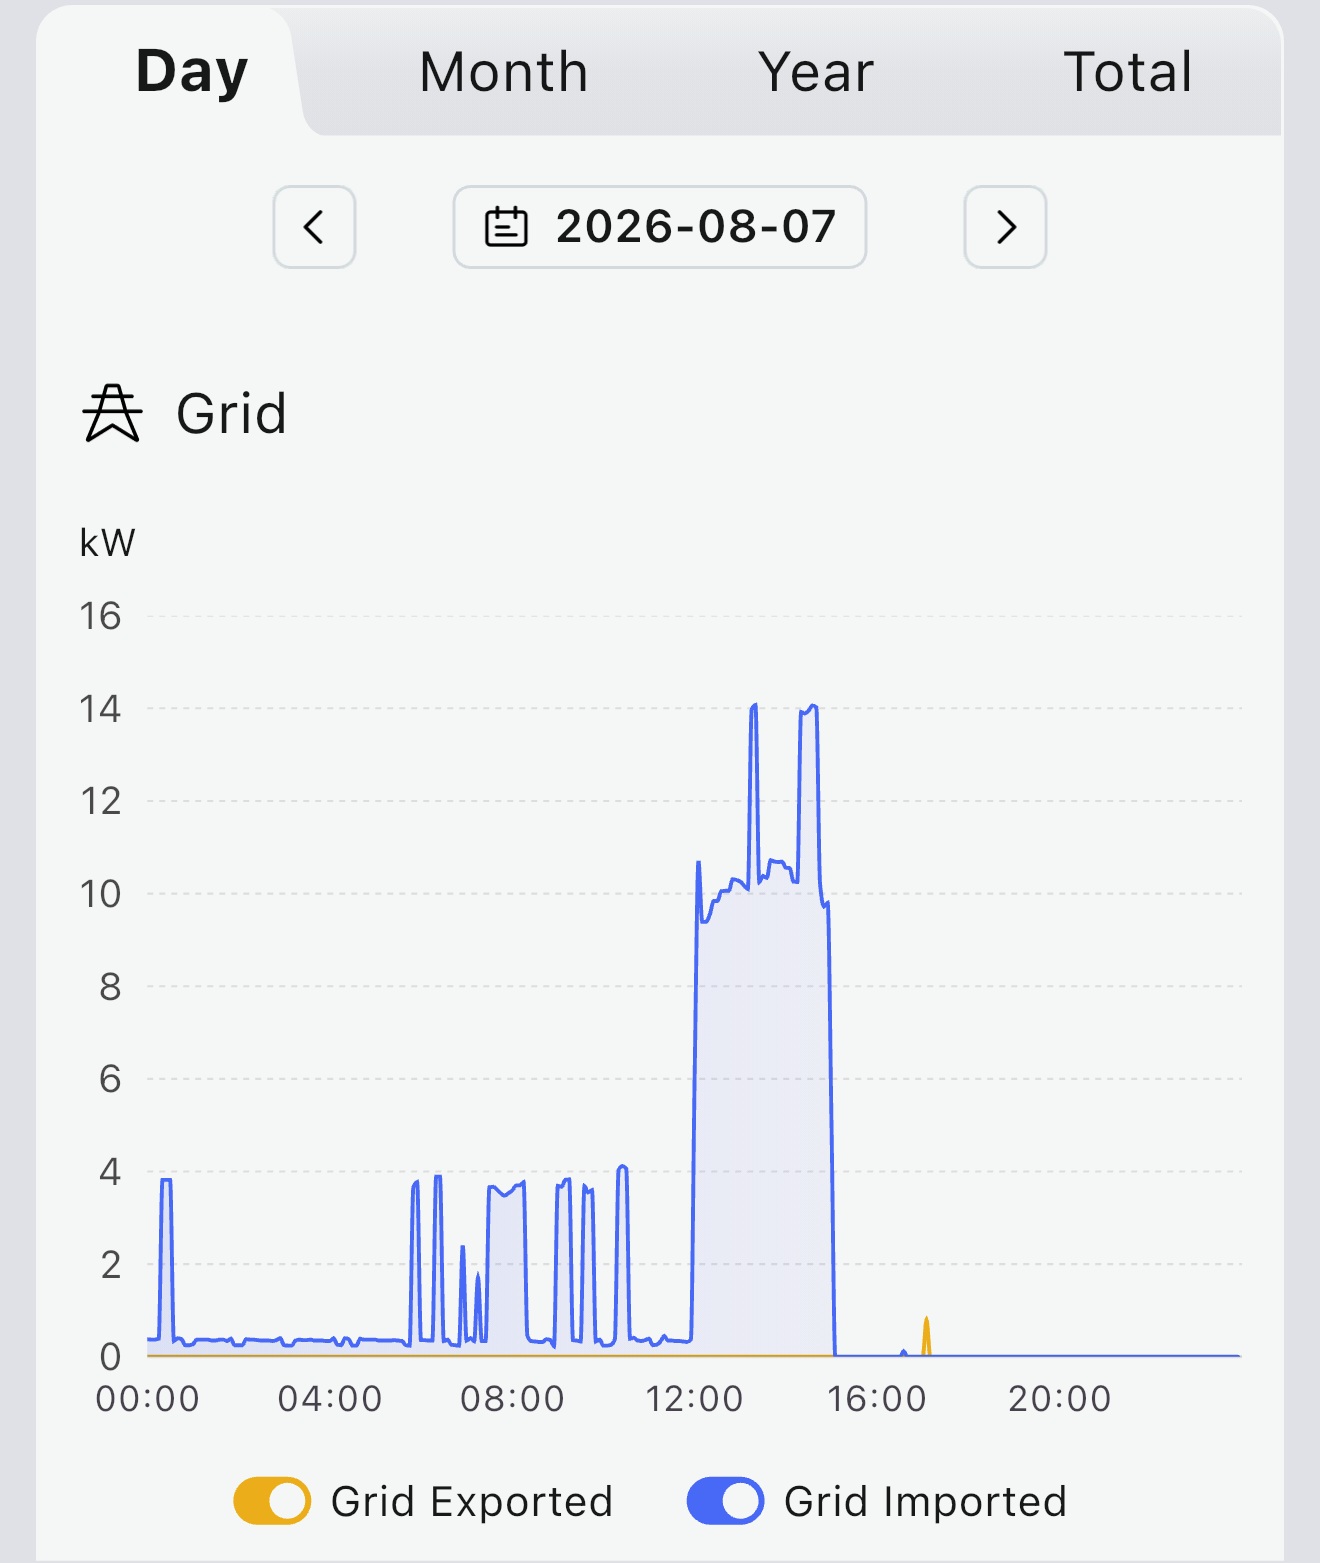
Original homeowner-supplied App screenshots show how the system operated on its commissioning day. They are a single-day example, not a typical-day benchmark or proof of long-term savings.
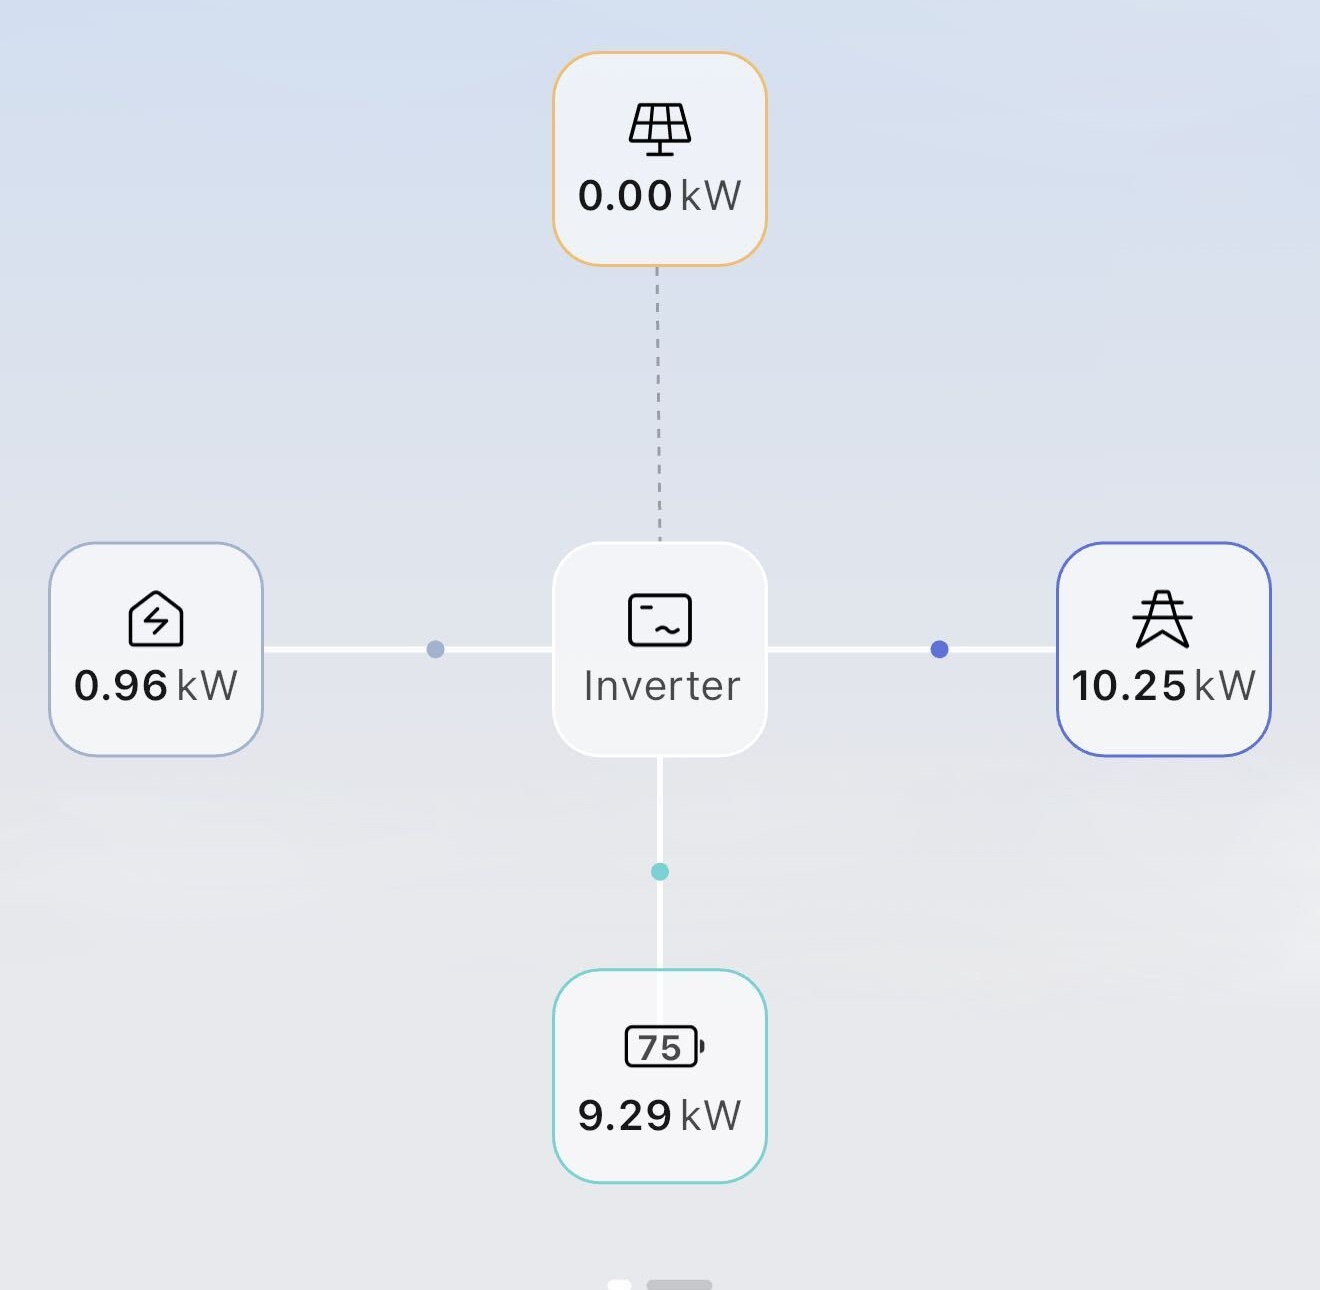
The battery curve shows charging around midday, rising state of charge, and discharge later in the day. The grid curve shows a midday import peak followed by very low displayed import.
These screenshots illustrate the operating sequence. They do not establish a precise daily energy total, the applicable tariff, or a guaranteed saving. Charging-window eligibility must be checked against the actual retail plan.
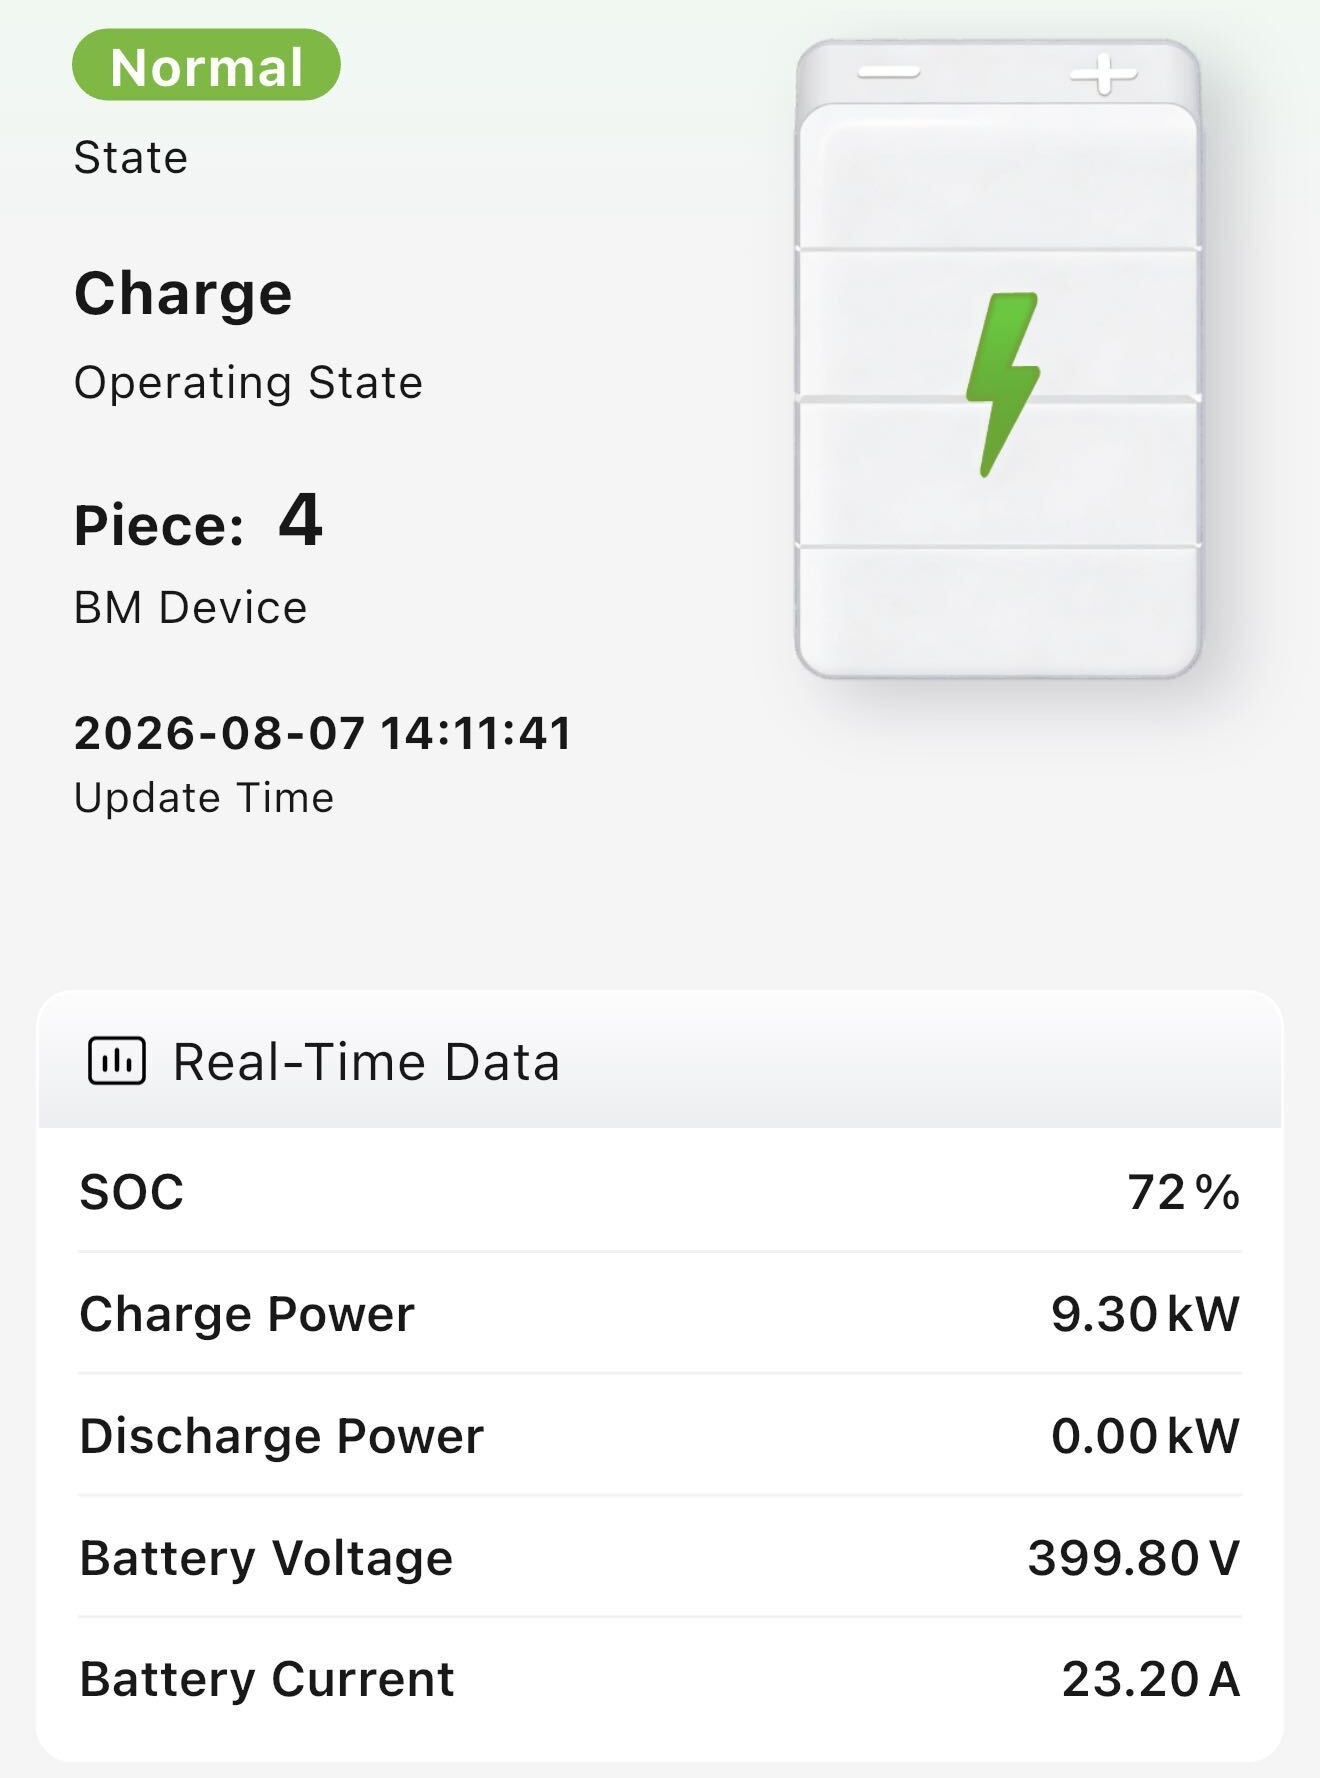
Device overview: update time 7 August 2026, 14:11:41; Normal state; charging; four BM devices; 72% SOC and 9.30 kW charge power. Snapshot times differ between screens, so individual values need not match.
05 / THE BILLS & THE ECONOMICS
The household’s paid 2025 electricity bills cover the same-season comparison window across a retailer change. Prorating the billed energy and supply charges to the matching dates gives an average of $14.85 per day, compared with $4.97 per day from the supplied 2026 bill after commissioning. The calculation method is detailed below.
| Measure | 2025 bill-based comparison | 2026 after commissioning |
|---|---|---|
| Comparison dates | 7 Aug – 6 Oct 2025 | 7 Aug – 6 Oct 2026 |
| Days | 61 (35 AGL + 26 ENGIE) | 61 (ENGIE) |
| Period cost | $905.66 (prorated) | $303.13 |
| Electricity / day | 29.78 kWh (prorated) | 35.38 kWh |
| Average cost / day | $14.85 (prorated) | $4.97 |
($14.85 − $4.97) ÷ $14.85 × 100
A bill-based comparison using prorated 2025 charges. The difference includes tariff changes and cannot be attributed solely to the battery; aligning bill credits may change the result.
$14.85 − $4.97
The supplied 2026 daily electricity use is about 18.8% above the prorated 2025 figure. Weather, household use, billing allocation and battery losses may contribute.
$10,000 ÷ ($9.88 × 365) ≈ 2.8
Annualising the indicative difference gives about $3,606. This is an unverified simple-payback illustration, not a forecast or guarantee.
THE STORY BEHIND THE NUMBERS
The family changed from AGL to ENGIE in September 2025, so last year’s comparison brings together bills from both companies. These were bills the household actually paid.
7 August–10 September · AGL
AGL’s final bill covered 69 days. To match the 35 days in our comparison, we divided its electricity and supply charges by the number of billing days, then multiplied by 35. That gives $598.33 including GST. AGL used an estimated meter reading, but the bill itself was real and the family paid it in full.
11 September–6 October · ENGIE
ENGIE listed this period separately on its bill. Adding the electricity and supply charges, with the plan’s 21% discount and GST, gives $307.33. Government bill-relief credits are not included in this figure.
Together: $905.66 over 61 days — an average of $14.85 a day.
This is a comparison calculated from paid bills, with AGL’s charges prorated to the matching dates. The calculation method is available below.
AGL: $598.33 for 35 days. We took the electricity and supply charges from the paid 69-day bill, added GST and prorated them to 35 days: ($357.89 + $637.20 + $77.24) × 1.10 ÷ 69 × 35. We used the same method for electricity use: 2,102 kWh ÷ 69 × 35 = 1,066.23 kWh. This spreads the bill evenly across its dates; it does not show what the home used on each individual day. AGL based its meter reading on an estimate; the family paid the bill in full.
ENGIE: $307.33 for 26 days. We used the charges listed for 11 September–6 October, added 26 days of supply charges, then applied the 21% discount and GST: ($119.78 + $204.25 + 26 × $1.1395) × 0.79 × 1.10. The $75 government credit on the longer bill has not been included in this 26-day calculation.
The daily comparison: $14.85 versus $4.97. The 2025 calculation totals $905.66 over 61 days. The supplied 2026 bill totals $303.13 over 61 days. Using the unrounded daily amounts gives a difference of about 66.5%. The plans changed, and the 2026 bill’s credits and adjustments still need to be checked on the same basis, so this is not a measure of battery savings alone.
The 2.8-year figure: $10,000 ÷ ($9.88 × 365). This simply extends the daily difference across a year. Future bills will vary, and the calculation does not include maintenance, battery ageing, replacement or financing costs. It is not a guaranteed payback.
06 / WHO IT MAY SUIT
Start with your bills and interval data. Battery size, charging power and tariff should be assessed together. The 28 kWh system in this story is not a size recommendation for every home.
07 / BEFORE YOU DECIDE
Yes, a suitably designed battery system can charge from the grid without rooftop solar. Compatibility, grid connection requirements, available space and your tariff need to be assessed.
It can, if your plan permits it and your equipment supports scheduled grid charging. Check the free window, any usage cap and charges above it. Charging losses and other household loads also use energy during that window.
No. Availability and eligibility depend on your location, meter and retailer. Compare current plans and the full tariff using Energy Made Easy or the relevant service for your state.
These figures compare charges calculated from paid 2025 bills with a supplied 2026 bill for the same dates. AGL used an estimated meter reading, and part of its bill was prorated to match the dates. Tariffs changed, so the difference cannot be attributed solely to the battery or used as a guaranteed payback. Your home needs its own assessment.
Only if compatible backup equipment and circuits are designed and installed for it. Confirm the circuits, power limits and reserved energy. A battery installation does not automatically include backup.
The homeowner reports a $10,000 investment with no subsidy received. This is not a current customer quote or an eligibility ruling. Any support for another installation must be checked against the current program rules.
A recent bill, interval usage if available, the full tariff, major appliance details and photos of the proposed equipment location. For shared case-study material, remove identifying information first.
08 / YOUR NEXT STEP
Bring a recent electricity bill and your daily habits. Sunterra can assess whether a battery and a suitable tariff make sense for your home.
Start with your usage. Choose the system around your life.
Review your energy use, installation needs and potential costs before choosing a system.
Tell our team your state and that you are interested in a battery without rooftop panels.